
Performance and traces
These pages show how the app performs: requests, database queries, browser speed, jobs, scheduled tasks, commands and logs. Each one links to the traces behind it.
Profiling during development
Lumberjack watches production. To profile a request, job or command in depth on your own machine, use Monocle.
Period and environment
Every page has two pickers at the top:
- Period: 1 h, 24 h, 7 d or 30 d. It starts at 24 h, except on Logs, where it starts at 1 h. Changes are compared with the period before.
- Environment: All environments, or one of the environments the project sent data from in the last week.
The pickers are part of the page address, so a link opens with the same choice.
Overview
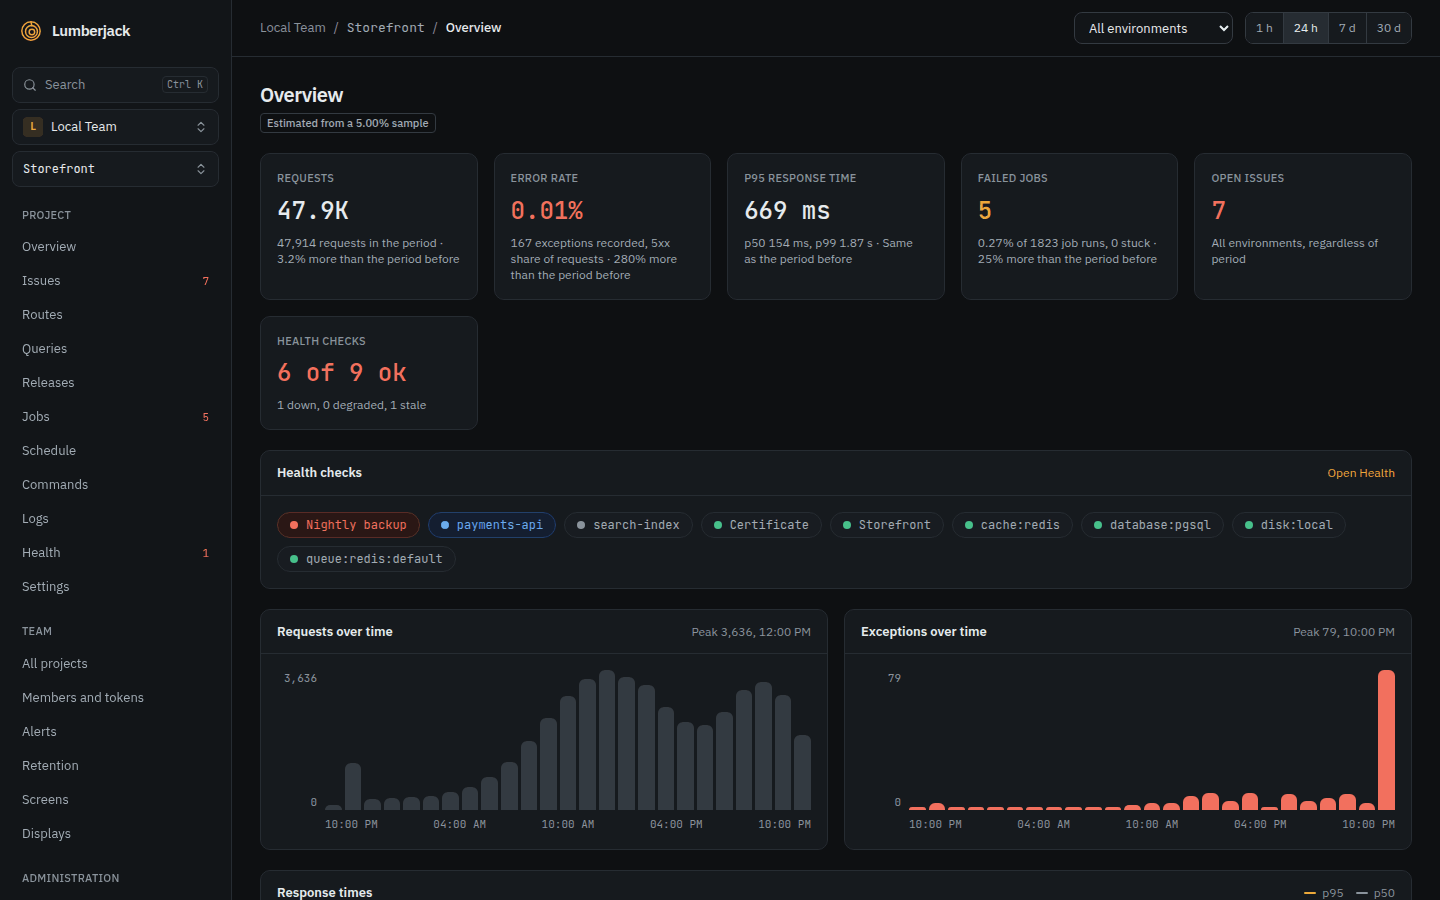
At the top, a card for each key figure, with the change from the period before:
| Card | Shows |
|---|---|
| Requests | Requests in the period |
| Error rate | The share of requests that answered 5xx, and how many exceptions were recorded |
| p95 response time | 95% of requests were faster than this. The p50 and p99 show below it |
| Failed jobs | The share of job runs that failed, and how many are stuck |
| Open issues | Open issues in all environments, whatever the period |
| Health checks | How many health checks are ok, and how many are down, degraded or stale |
Below the cards, a chip for each health check shows its state in color: red for down, amber for degraded, blue for recovering, gray for stale or pending.
Then come charts of Requests over time, Exceptions over time and Response times (p95 and p50), and the Latest issues, Slowest routes (p95) and Failed jobs of the period. When the app samples its data, a note says so; see Sampling.
Pages
Requests, Database, Browser, Jobs, Schedule, Commands and Logs each have a page in the sidebar.
Requests
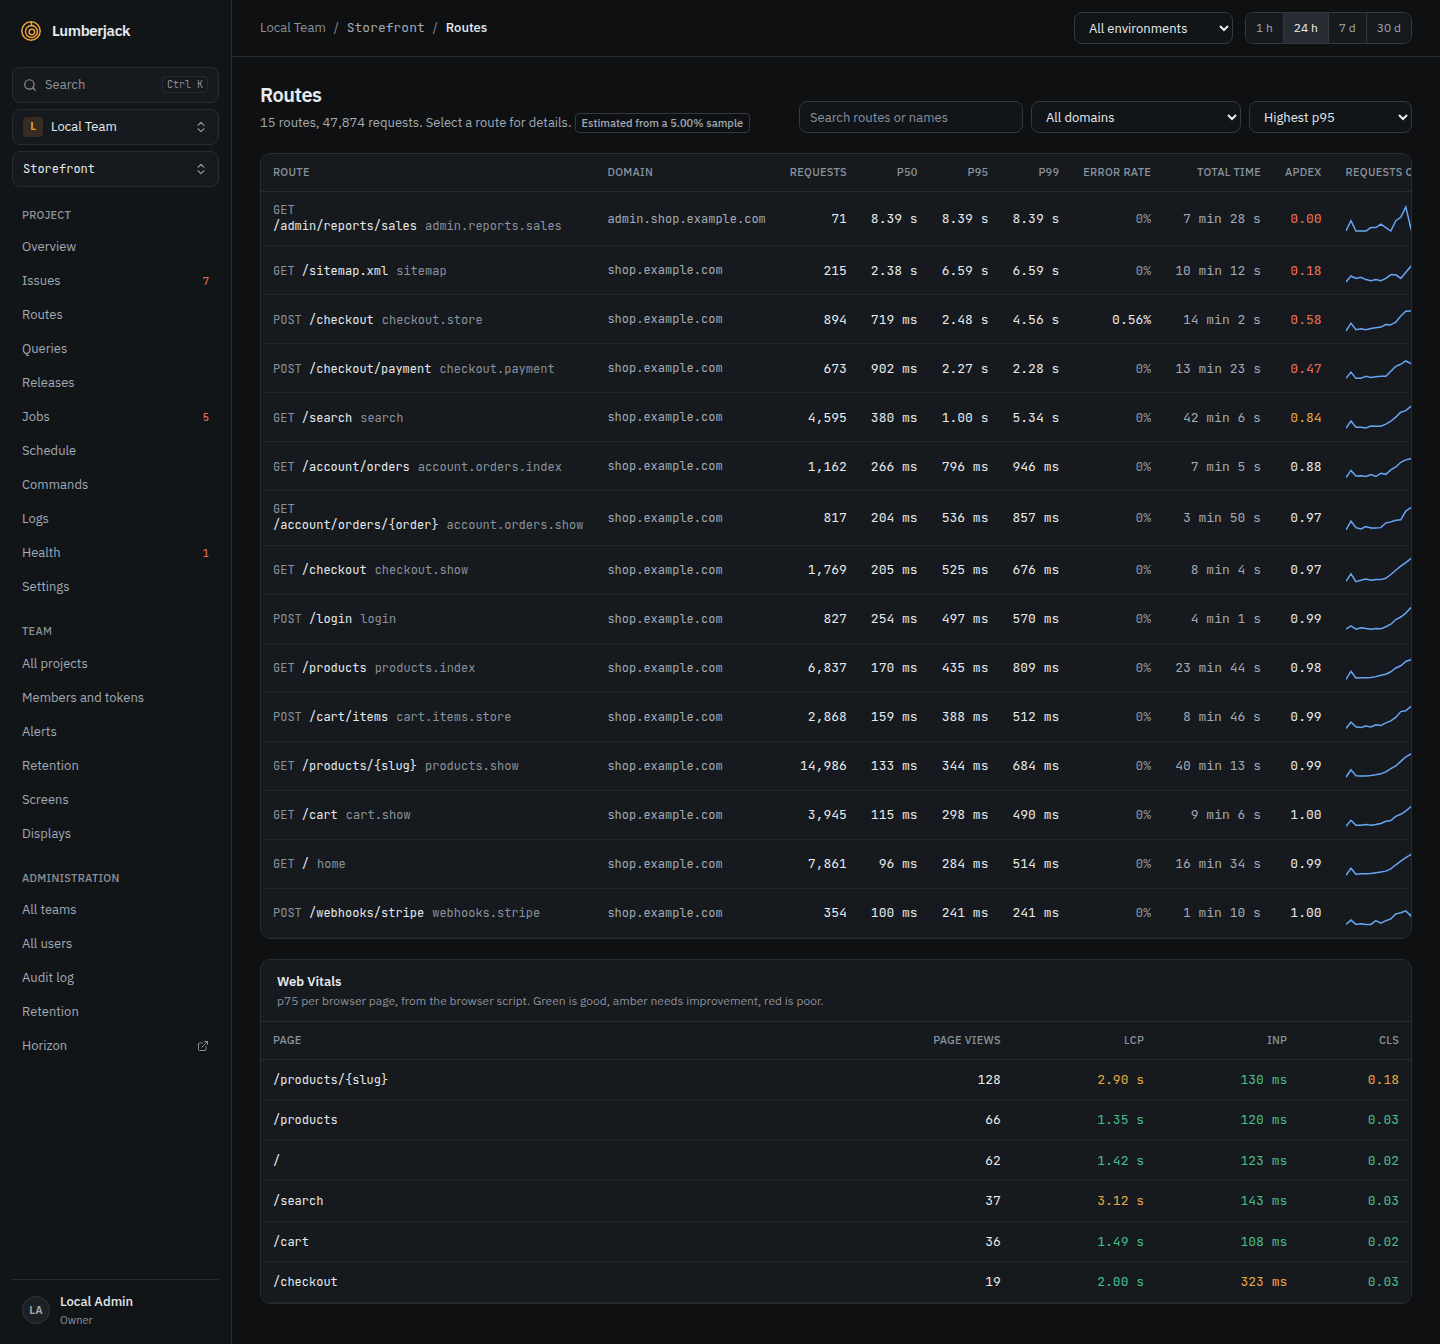
Each route shows its requests, p50, p95 and p99, 5xx rate and Apdex. Sort by highest p95 (the default), most requests, highest error rate, most total time or lowest Apdex. Search routes or names uses the search syntax and matches a route's URI or its route name, such as orders.show.
A route's details show its p50 and p95 over the period, its status codes and its 10 slowest requests with their query counts.
When requests came in on more than one domain in the period, a Domain picker appears next to the search. With All domains, the same route on two domains shows as two rows, with a Domain column.
Database
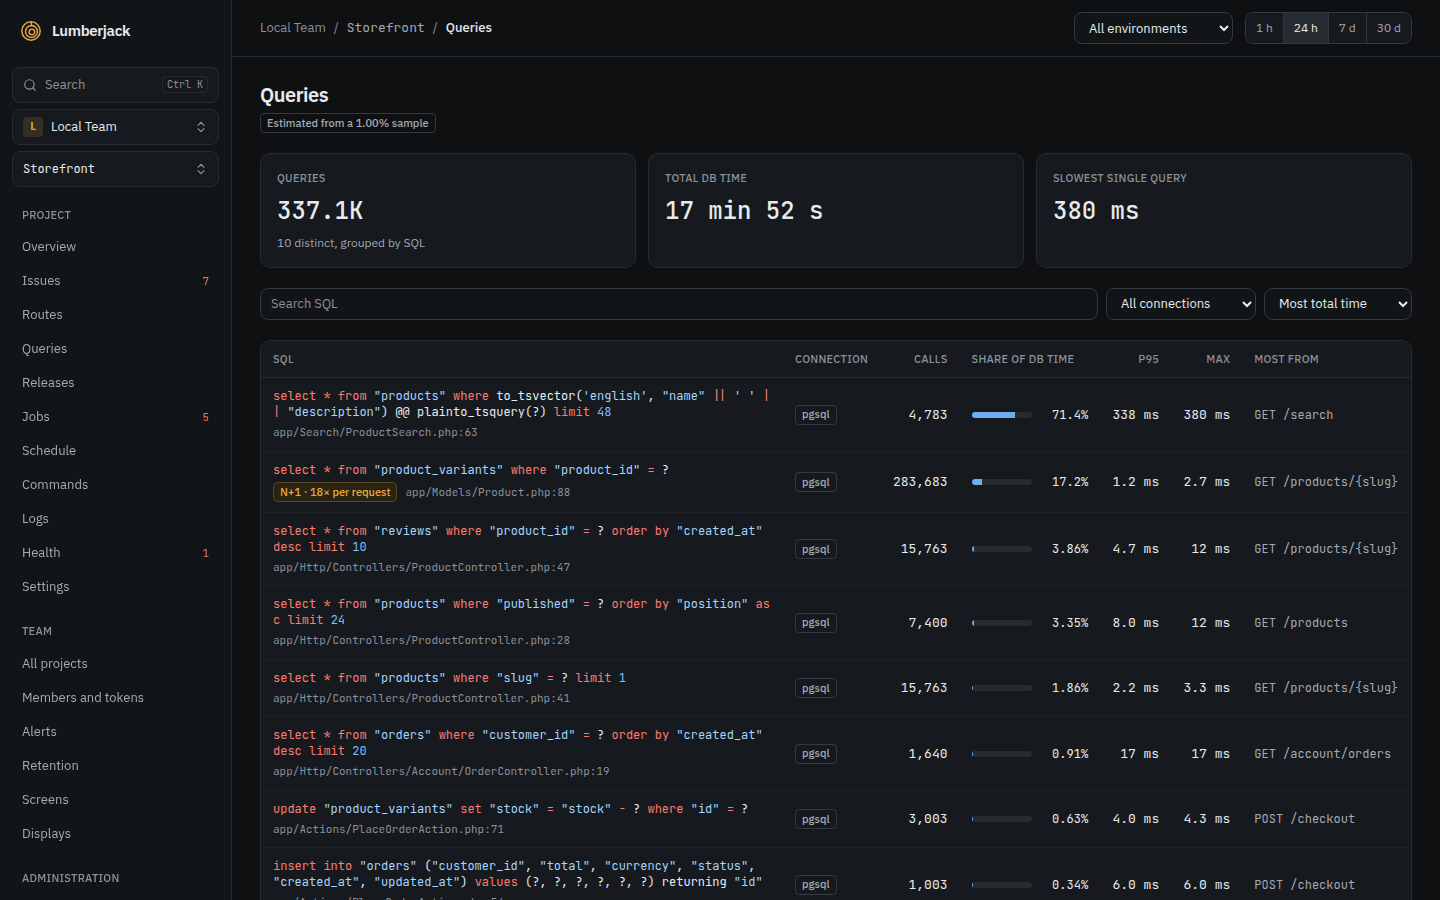
The top shows the number of queries, the total database time and the slowest single query. Each query shows its calls, total time, share of database time, p95 and max. Filter by connection, search the SQL, and sort by most total time, highest p95 or most calls. Most from is the line in the app that ran the query most often.
A query is flagged N+1 when it runs 5 times or more in one request or job. With 7 or 30 days picked, Most from and the N+1 flag cover the last 24 hours only.
Jobs
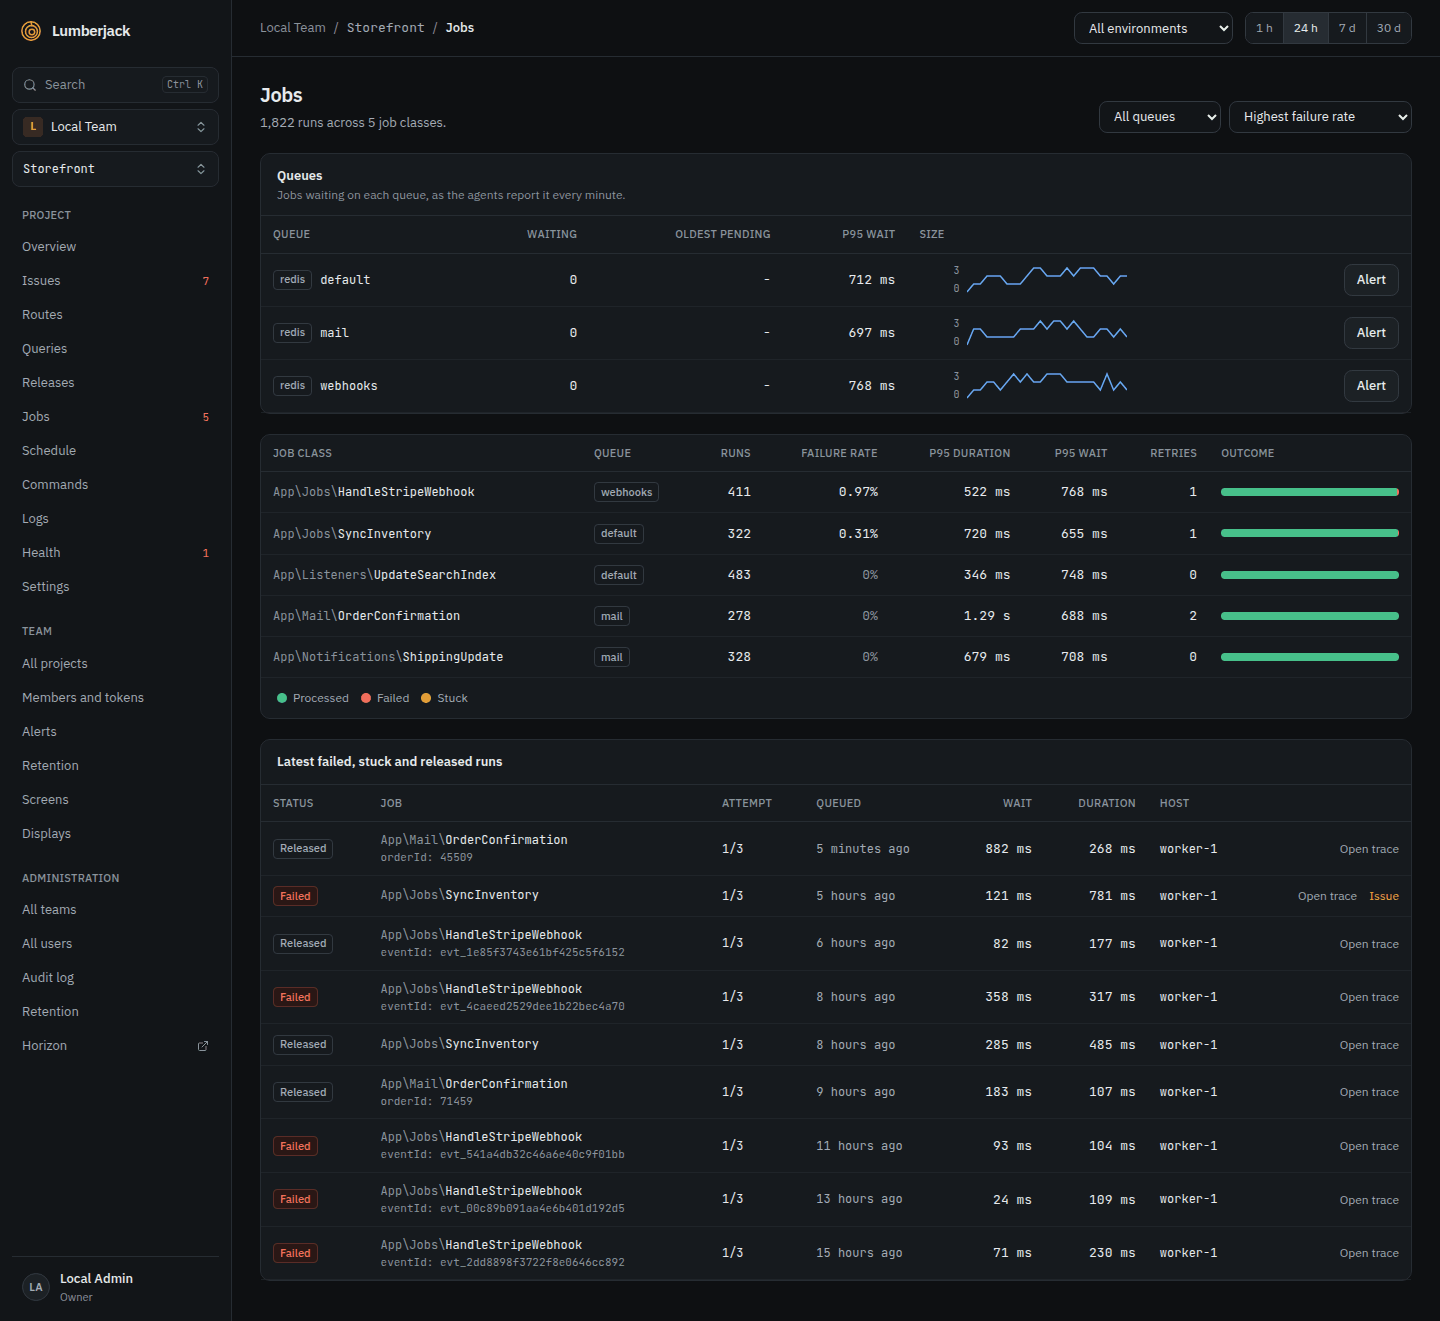
Each job class shows its runs, failure rate, stuck and retried jobs, duration and wait time. Filter by queue and sort by highest failure rate, most runs, highest p95 duration or highest p95 wait. Below the job classes are the latest failed, stuck and released runs, with their parameters, an Open trace and the issue they became.
A run is Queued, Processing, Processed, Released (put back on the queue), Failed or Stuck. A run is stuck when it has been processing for longer than its timeout plus 2 minutes, or 10 minutes for a job without a timeout. A banner links to the stuck runs.
Queues
The Jobs page shows a Queues card once agents report queue sizes (the queues the SDK is set to watch). Per connection and queue:
- Waiting: jobs on the queue now. Gray when no agent has reported the queue for 5 minutes.
- Workers: how many workers run on the queue, when the SDK reports it. Red when jobs wait and no worker runs. A worker on several queues counts on each.
- Oldest pending: how long the oldest waiting job has waited, for Redis and database queues.
- p95 wait: time from queued to started of the jobs that ran in the period.
- Size: the highest size per bucket over the period.
- Alert: the queue's own backlog alert thresholds, for team owners and admins. custom marks a queue with its own thresholds, muted a queue that never alerts.
A queue backlog alert catches a queue that grows because every worker is dead.
Schedule
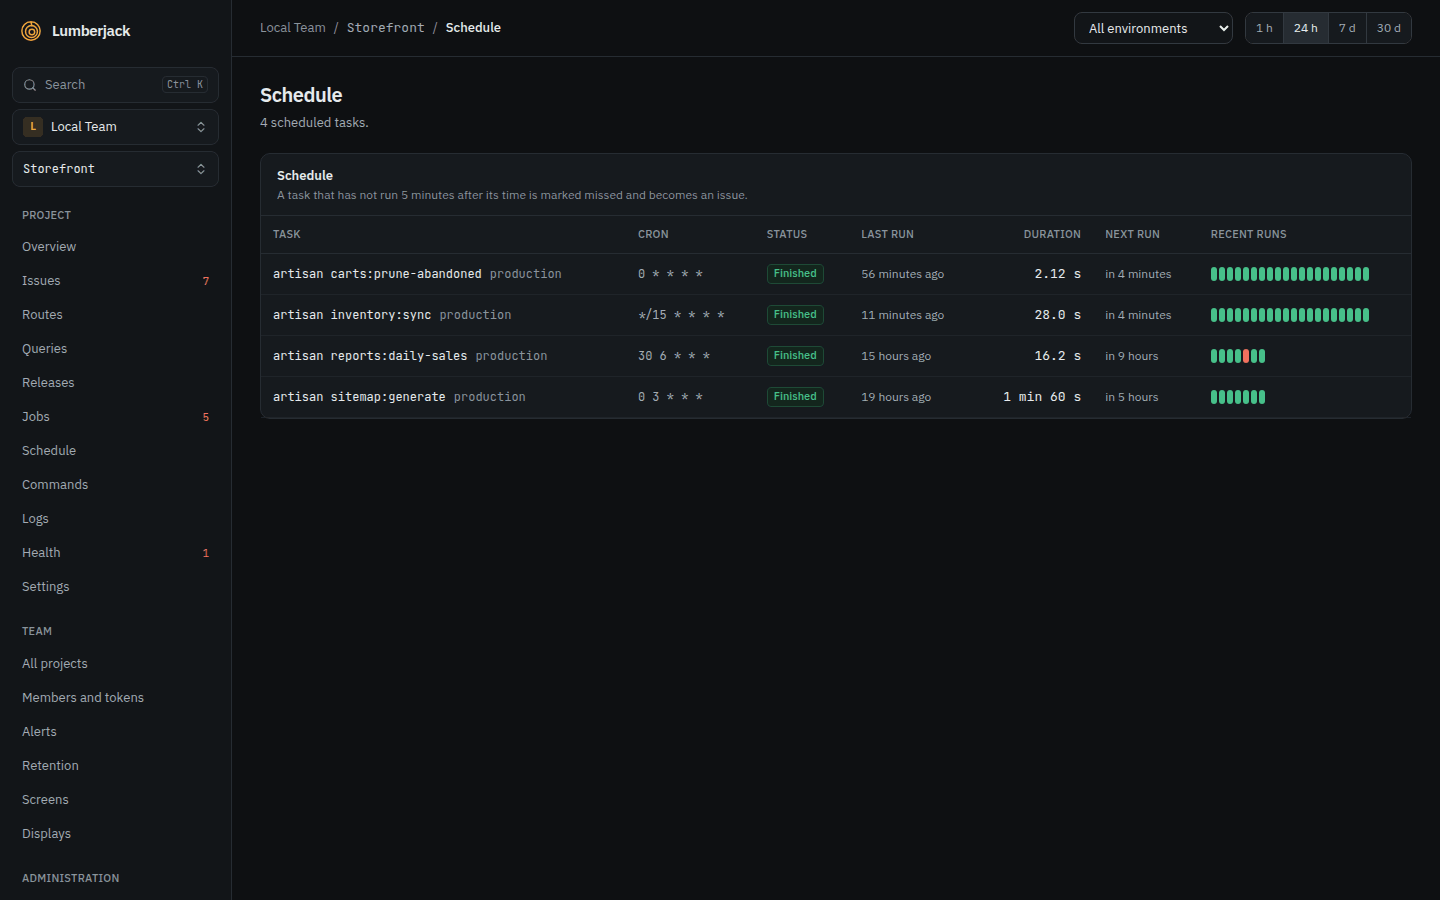
Each task shows its cron, its latest status (Running, Finished, Failed, Skipped or Missed), the last and next run and a strip of its last 20 runs. A task's details list its runs with their exit code and host.
A run is late after a minute, and missed when it has not started 5 minutes after its time. A missed run becomes an issue. A task that has not been reported for 24 hours is no longer flagged. Forget task, for owners and admins, deletes a task that is gone from the app, with its runs.
Commands
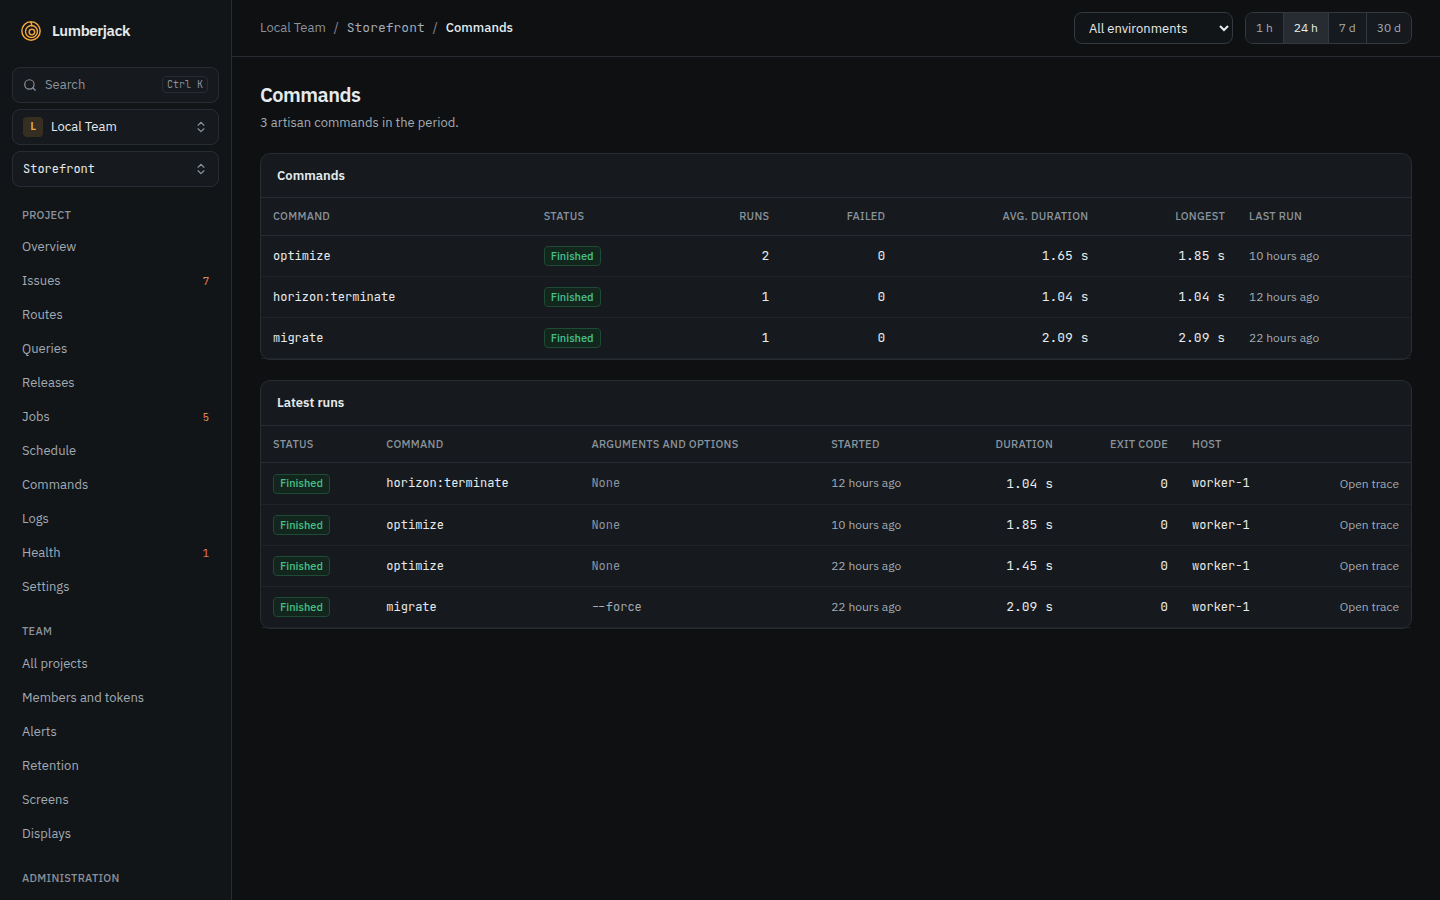
Each command shows its runs, failures, average and longest duration, last run and status. The latest runs below show their arguments and options, exit code and host. Queue workers are not listed.
Logs
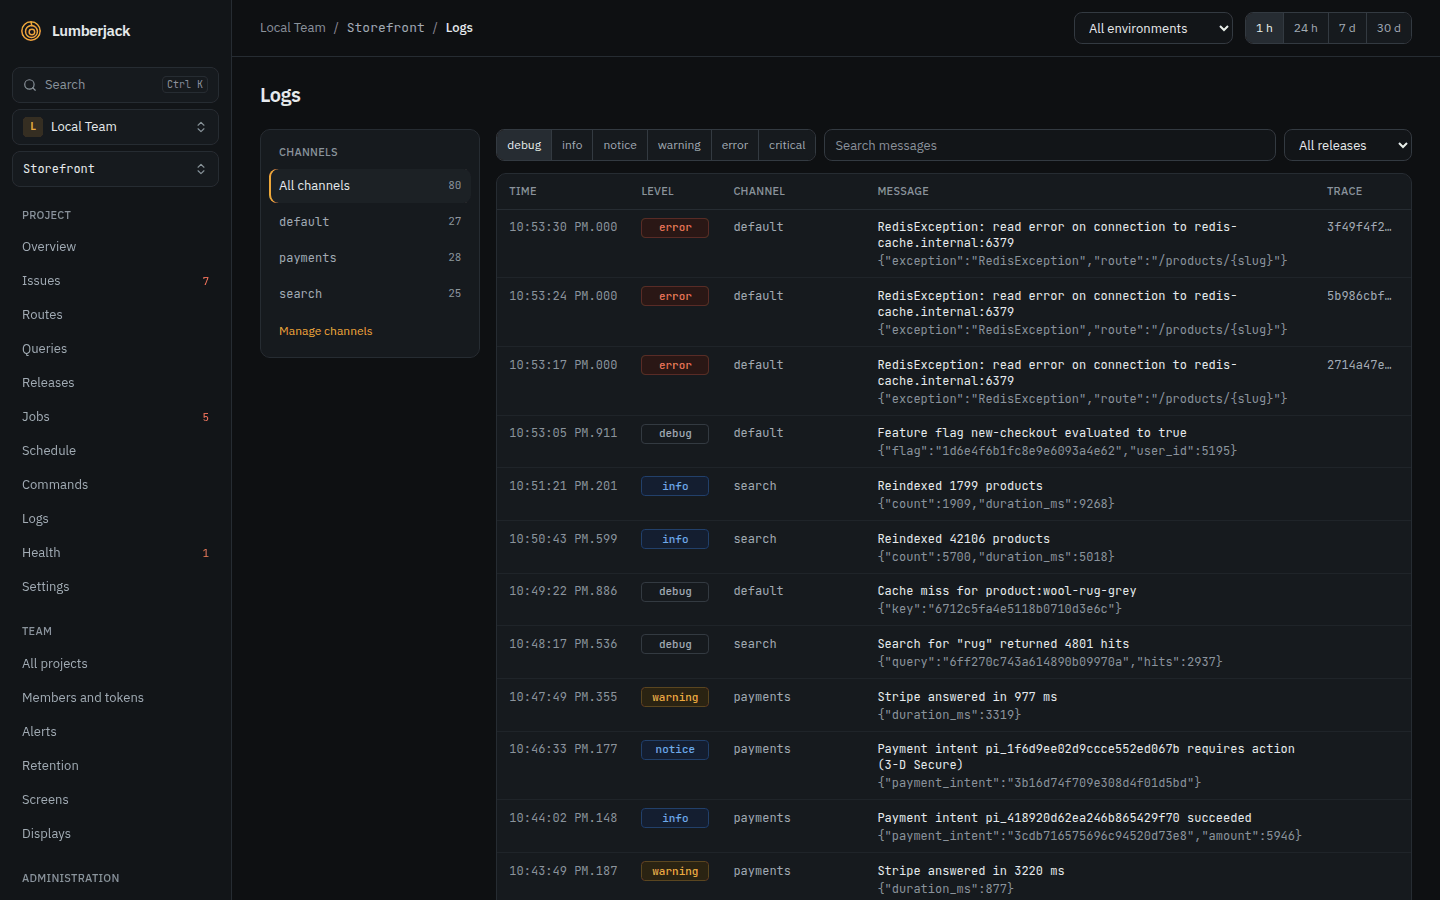
Filter by channel, minimum level (debug to emergency) and release, and search the messages. The page shows the newest 200 lines; narrow the filters to see older ones. The search matches whole words, without the * syntax of the other search fields. Manage channels opens the project's log channels.
New lines appear while you are at the top of the list. When you have scrolled down or selected text, Show new lines appears instead.
Sampling
A busy app's SDK may record only a share of its requests; see the SDK's docs. The pages then show estimates, marked Estimated from a 10% sample with the lowest rate in the period.
- Exact: request counts, throughput, error rate and status codes, as the SDK counts every request. Jobs, commands and scheduled tasks are recorded on every run, so their counts, failure rates and durations are exact too.
- From the sample: p50, p95 and p99, Apdex, and query calls and times. A route whose requests were counted but none sampled shows no percentiles.
- Releases estimate their requests and error rate from the recorded requests.
Apdex
Apdex scores a route from 0 to 1 by how fast its requests felt:
| Request | Counts |
|---|---|
| Within 500 ms | 1 |
| Within 2 s | ½ |
| Slower, or a 5xx error | 0 |
A score below 0.85 shows in amber, below 0.7 in red.
Browser
Browser shows how fast pages are for the people using them. The browser script measures Core Web Vitals on every page view, with the class of device: mobile, tablet or desktop.
At the top, cards show page views and the 75th percentile (p75) of each vital, colored by Google's thresholds. Each card also shows the share of page views rated good and the change from the period before:
| Vital | Good | Poor |
|---|---|---|
| LCP | ≤ 2.5 s | > 4 s |
| INP | ≤ 200 ms | > 500 ms |
| CLS | ≤ 0.1 | > 0.25 |
Between good (green) and poor (red) is needs improvement (amber). INP is the slowest interaction of the page view.
All, Mobile, Tablet and Desktop next to the title narrow every figure on the page to one class of device. LCP by device puts the p75 LCP of the three side by side.
Below them, a chart per vital shows its p75 per bucket of the period, and Pages lists each page path, with ids grouped as {id}, with page views and the p75 of LCP, INP, CLS, TTFB (time to first byte) and FCP (first contentful paint). Sort it by most viewed or slowest LCP.
Browser errors counts the occurrences of browser issues in the period, on every device, and lists the issues with the most; All issues opens them in the issues list.
Values below zero or above a minute are ignored. Web vitals are kept for 30 days by default, see retention. Until a project receives any, the page shows how to add the browser script.
Traces
Everything recorded during one request, job, command or scheduled task shares a trace id. Open trace (on a request, a run or an occurrence) shows it on one time axis:
- the request or job, then
- queries,
- spans: cache reads and writes (hits and misses), outgoing HTTP calls, mails, notifications and Redis commands,
- log lines and exceptions.
The header names the request's route, route name and domain. Above the timeline, a summary counts the queries, outgoing calls, cache operations and misses, mails, notifications, Redis commands, log lines and exceptions. Which spans are recorded depends on the SDK.
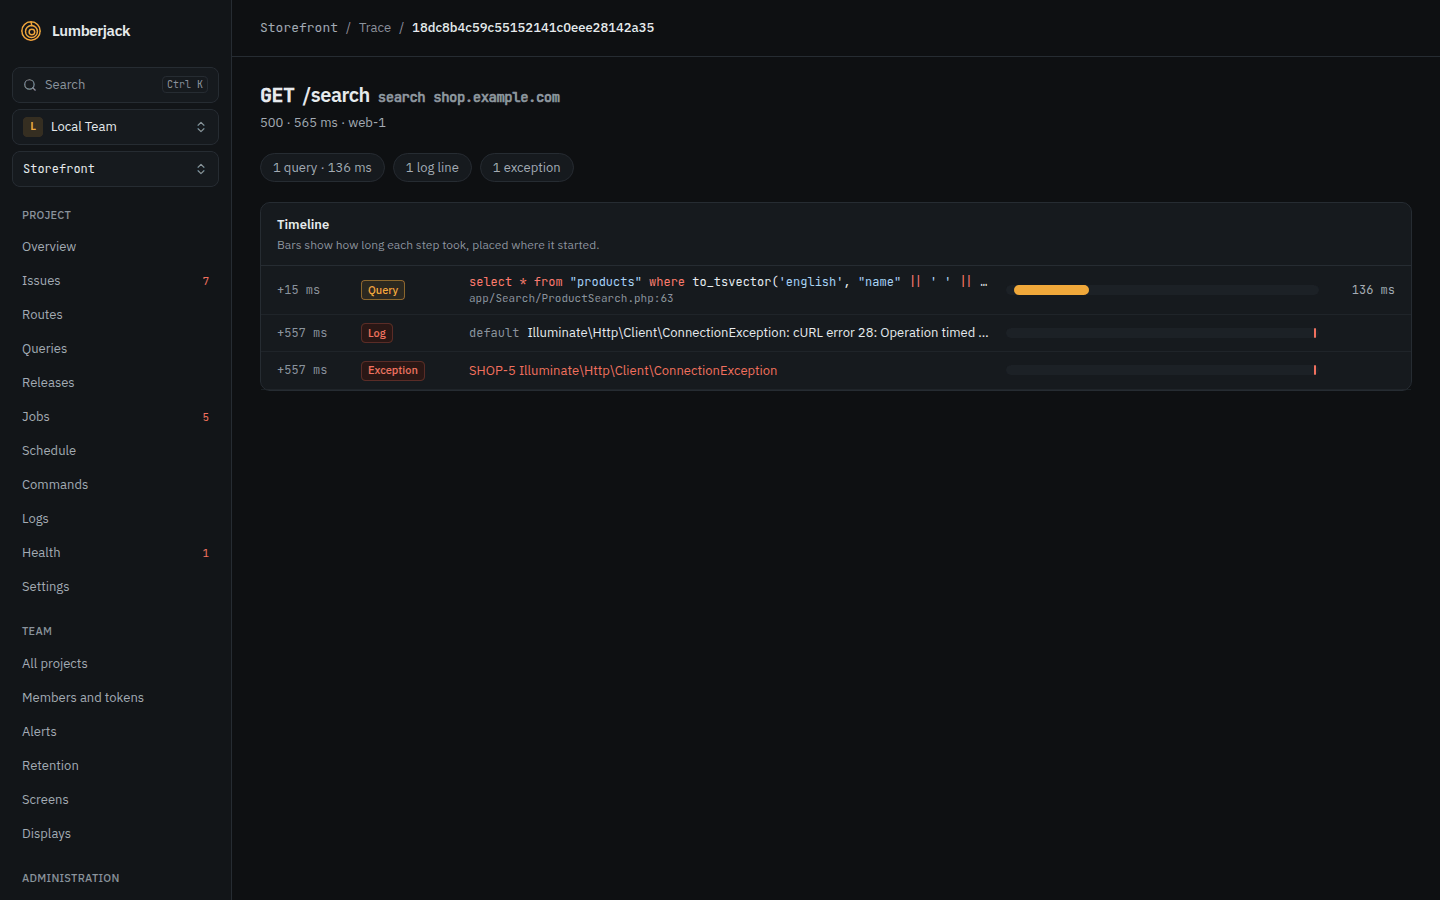
Paste a trace id in the command palette to open it.
Limits
| What | Limit |
|---|---|
| Queues on the Queues card | 20 |
| Log lines on the Logs page | The newest 200 that match the filters |
| Steps in a trace | 500 |