
Find out why a page is slow
Go from "the site feels slow" to the route, the request and the query that cause it.
Pick the period (1 h, 24 h, 7 d, 30 d) and the environment, usually production, at the top of each page.
1. Check the overview
On the project's Overview, the p95 card shows how slow the slowest 5% of requests are, with the p50 and p99 and the change since the period before. The response time chart shows when it got slow, and Slowest routes (p95) lists the worst routes.
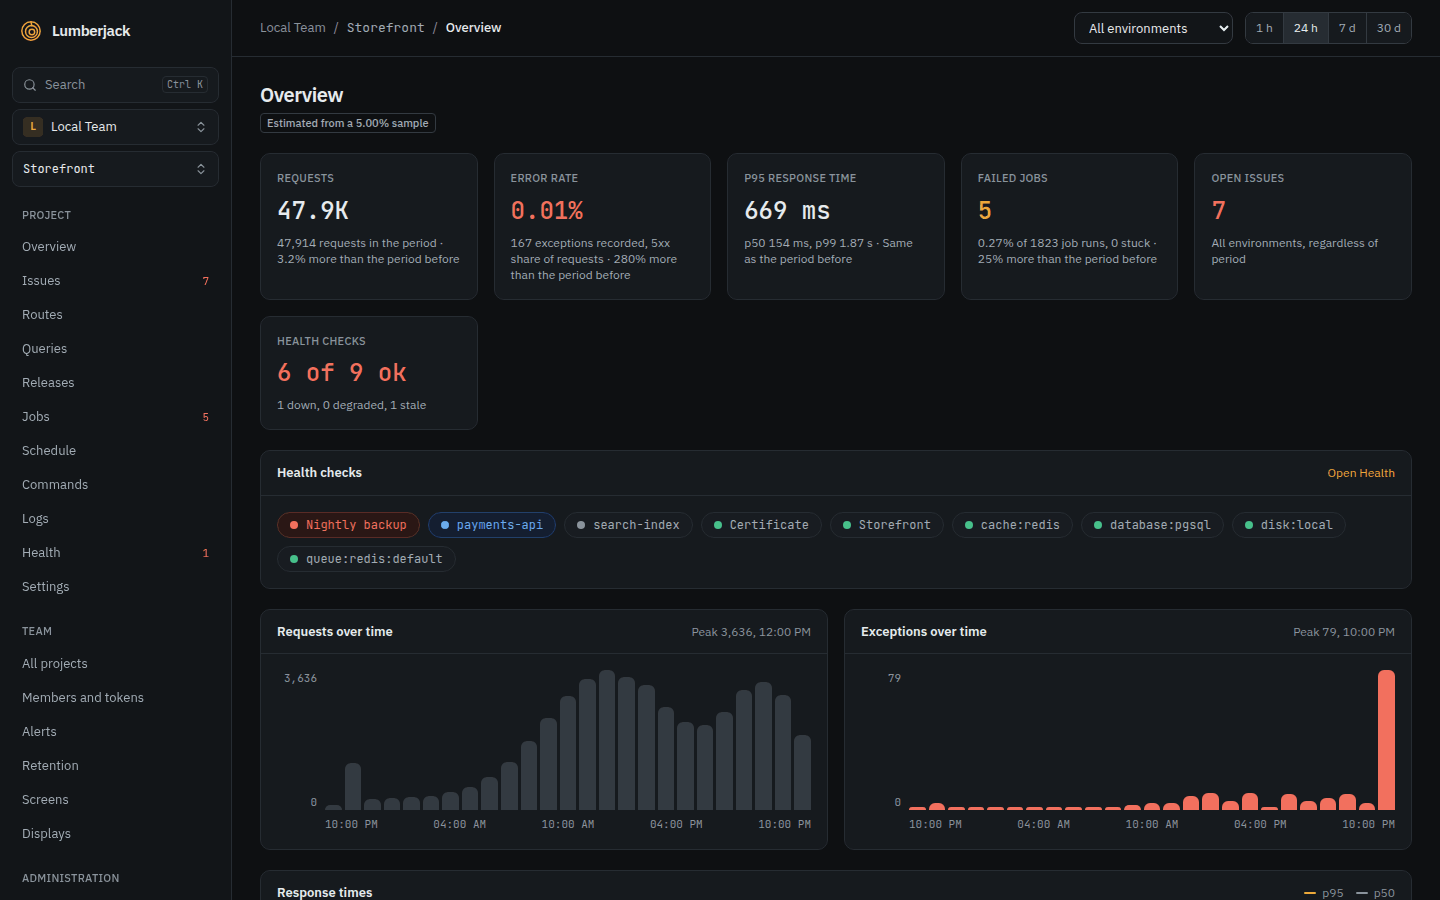
What to look for: a p95 that went up, or a jump in the chart. A jump right after a deploy points at a release: see Check whether a release went well.
2. Find the route
Open Requests in the sidebar. The table is sorted by Highest p95.
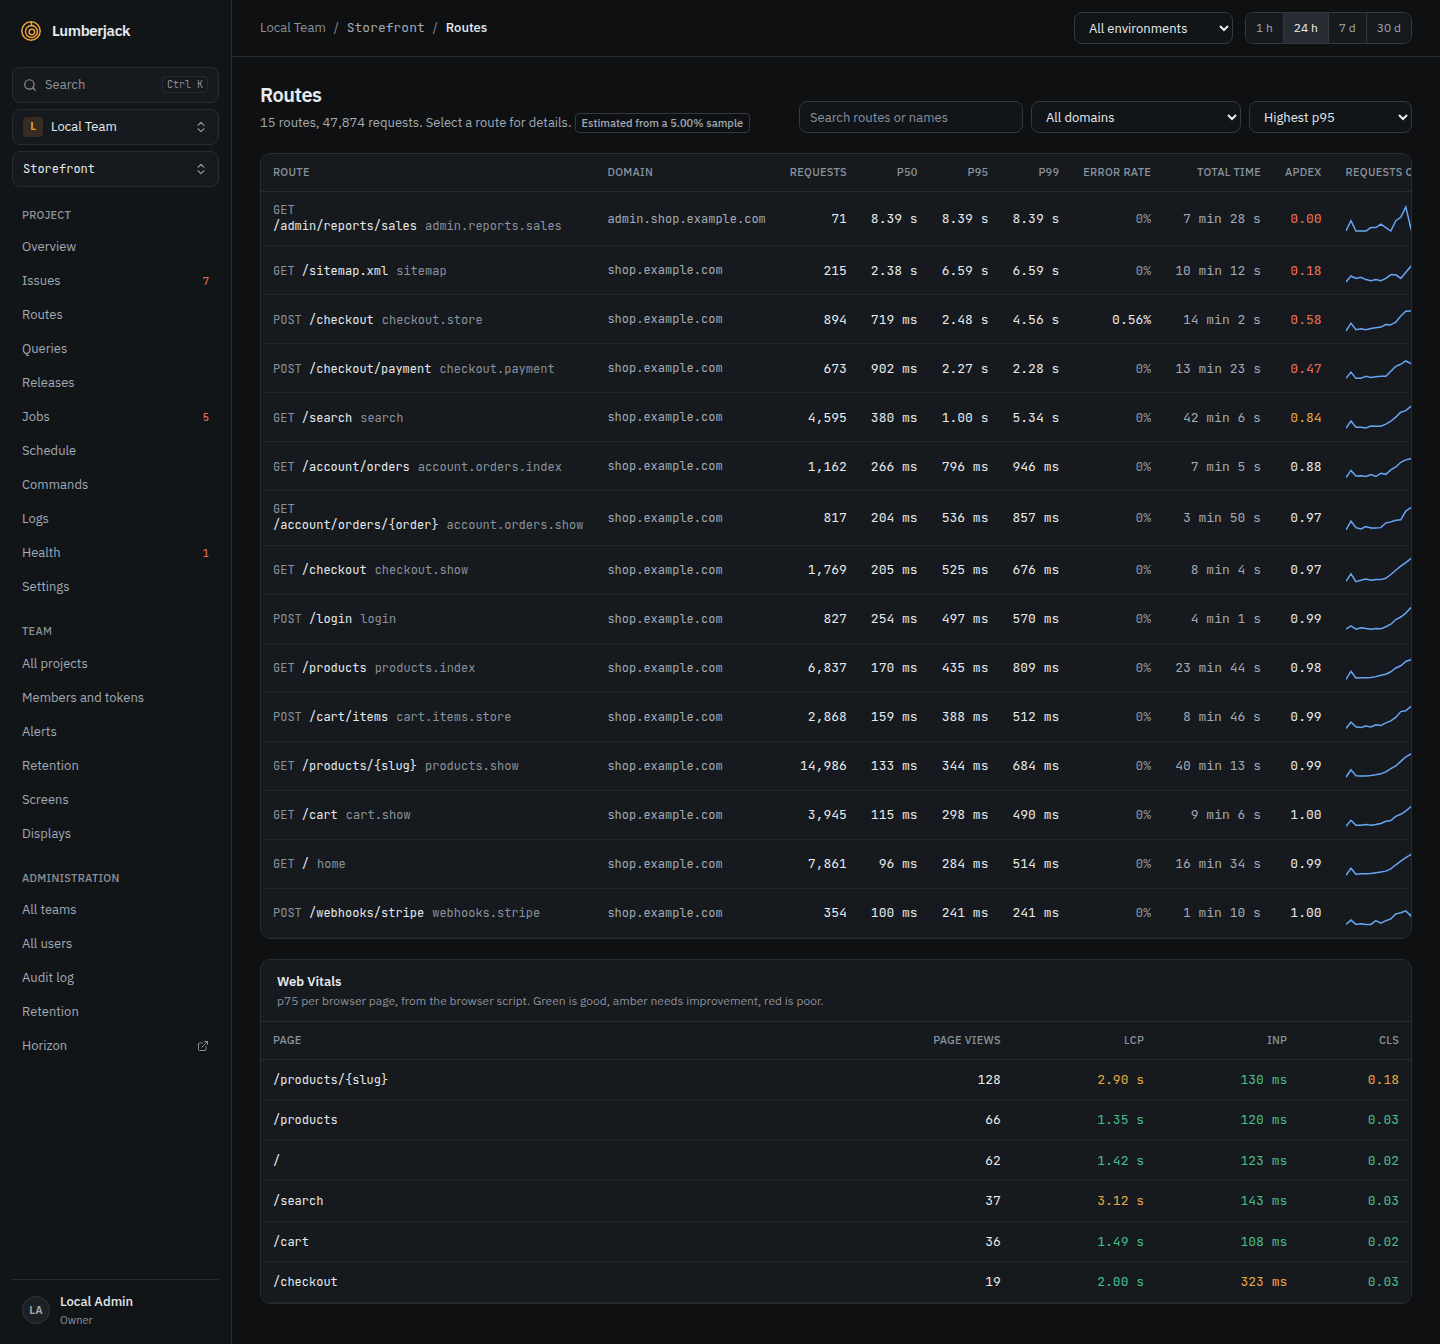
- Most total time finds routes that are a bit slow but called all the time.
- Lowest Apdex finds the routes people wait on most.
- Search routes or names finds a route by URI or by name (
orders.show).
A route's detail shows its p50 and p95 over the period, its status codes, and its Slowest requests with their query counts.
What to look for: a request with hundreds of queries, or a p95 far above the p50.
3. Open a trace
Click the trace id of a slow request. The trace shows everything that request did on one time axis: queries, cache reads and writes, outgoing HTTP calls, mails, notifications, log lines and exceptions. The summary above it counts the queries, outgoing calls, cache operations and misses.
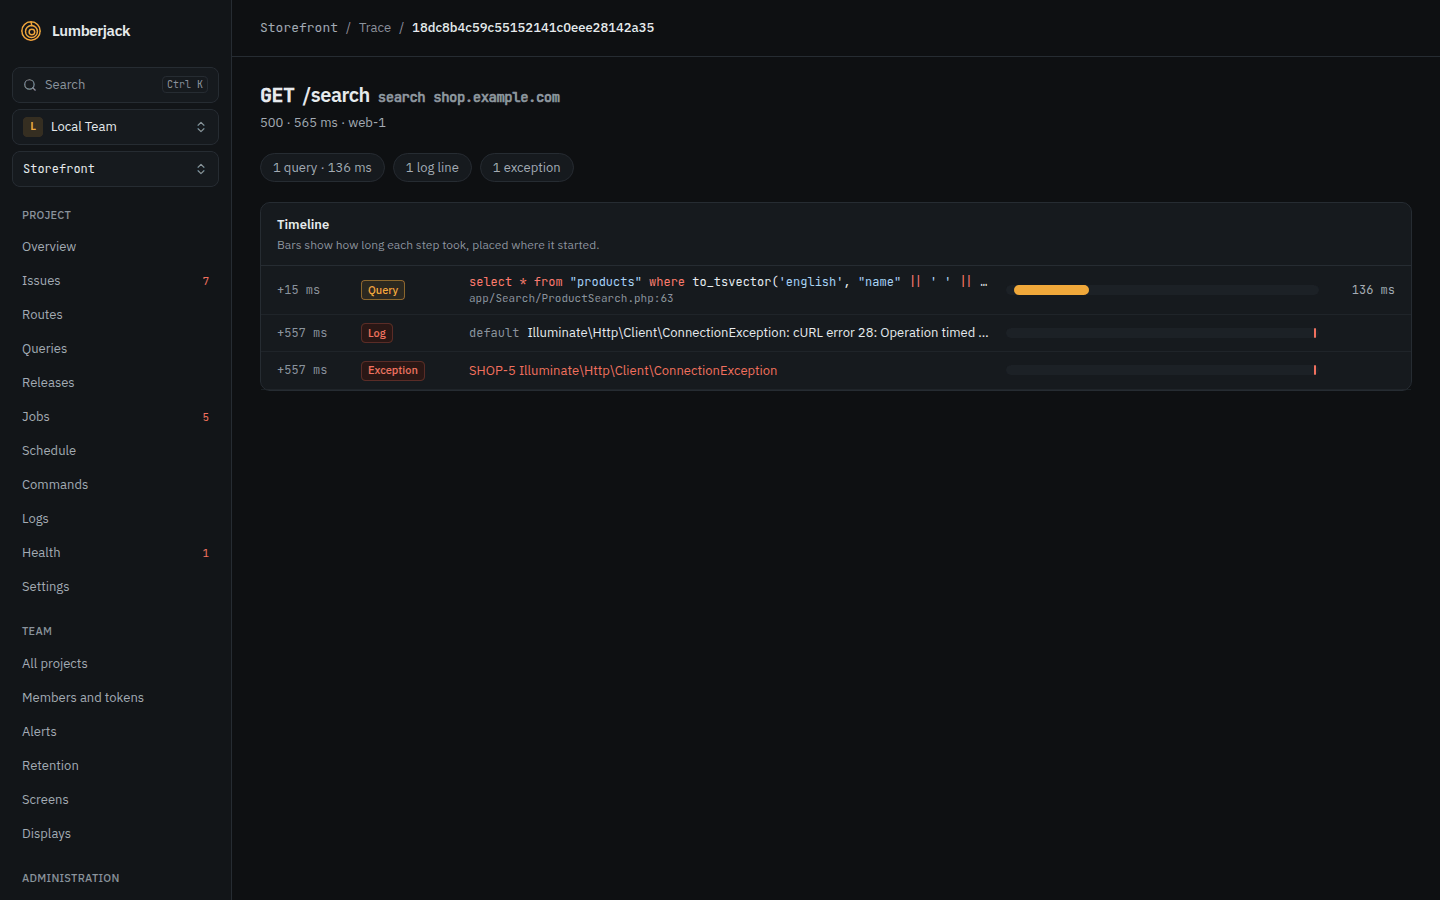
What to look for:
- One long bar: a slow query or a slow outgoing call.
- A long row of short, identical queries: an N+1.
- Many cache misses on a page that should be cached.
- Gaps with nothing in them: time spent in PHP itself.
4. Find the queries
Open Database in the sidebar. Queries are grouped by their SQL, ignoring the values.
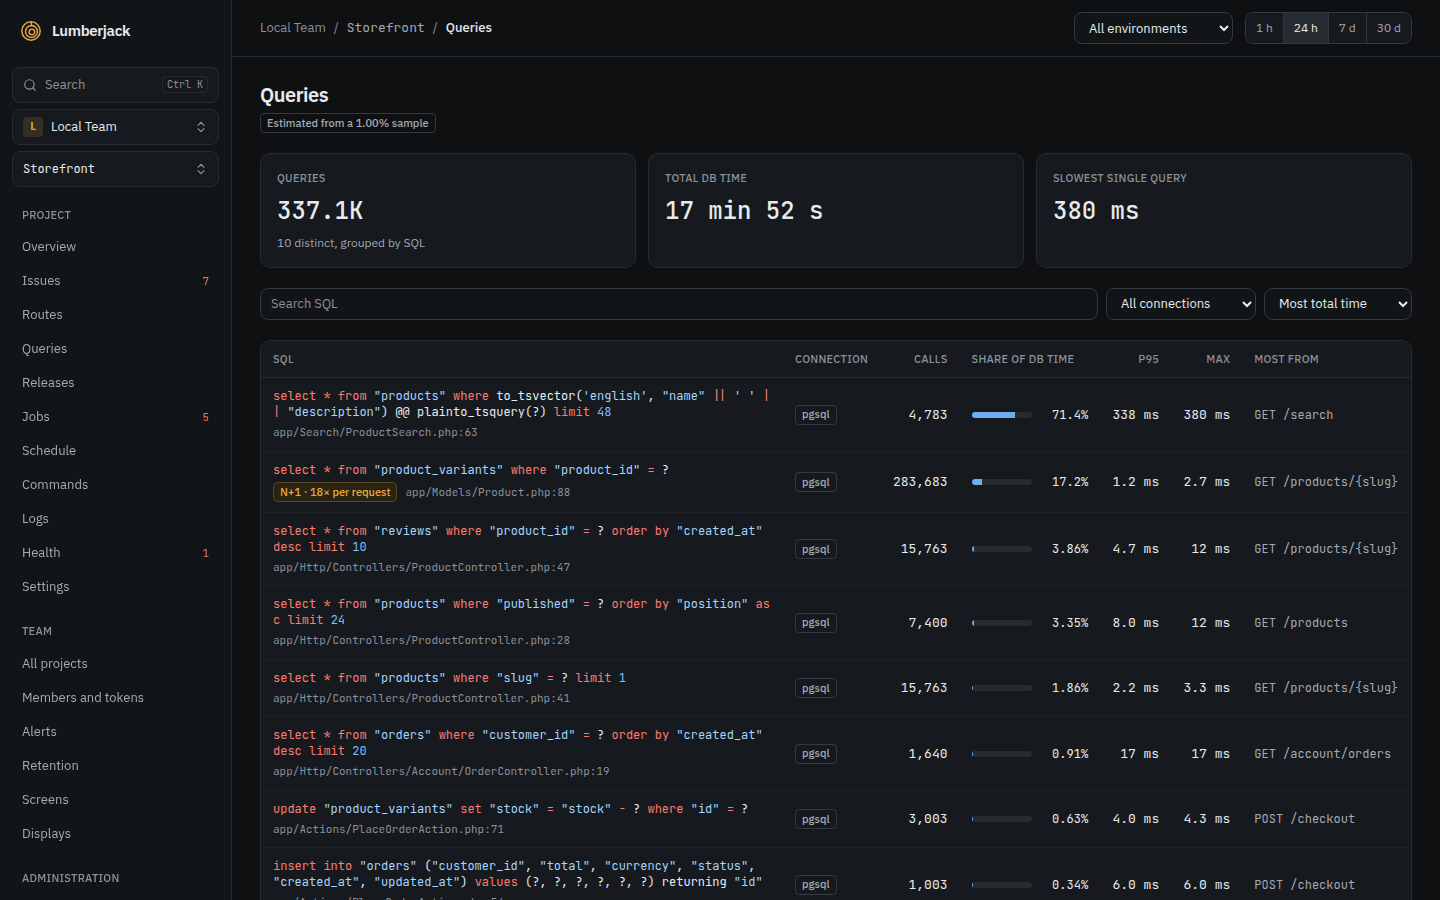
- Most total time shows where the database spends its time.
- Highest p95 shows the single slowest queries.
- Most from shows the line in your app that ran the query most often.
A query marked N+1 ran 5 times or more in one request or job; the badge says how many times per request. Fix it with eager loading.
5. Compare with before
- The overview cards compare every number with the period before. Switch to 7 d or 30 d to see a slow trend.
- Releases puts each release's p95 next to the one before it. A red arrow means it got worse.
- On a status screen, a Chart widget can Overlay the previous period, and a Stat can Compare with the same time yesterday or last week. See Widgets.
6. Check what the visitor sees
Open Browser in the sidebar for Core Web Vitals from real visitors: LCP, INP and CLS, by page and by device. A fast server with a poor LCP means the page is slow in the browser. This needs the browser script on your pages.
When numbers are estimates
A busy app may record only a share of its requests, and the pages then say, for example, Estimated from a 10% sample. Request counts and error rates stay exact; percentiles come from the sampled requests. See Performance and traces.
Profiling during development
Lumberjack watches production. To profile a request, job or command in depth on your own machine, use Monocle.
Reference
- Performance and traces: every page, Apdex, sampling and traces.
- Finding things: the search syntax and pasting a trace id in the command palette.