
Health
The Health page of a project shows whether the things your app depends on work: its database, cache, queues and disks, the URLs people visit and their certificates. Checks come from two places and work the same once a result is in.
| Source | Where it runs | Set up |
|---|---|---|
| Reported by the app | Inside the app, sent through ingest | In the app, through its SDK |
| Run by Lumberjack | This server, on an interval you pick | On the Health page, Add check |
Checks the app reports
The SDK runs checks inside the app and sends their results with the rest of its data. See the SDK's documentation for registering and scheduling checks.
A check is known by its slug (database:pgsql, disk:s3, queue:redis:default) within an environment. A new slug becomes a new check on its first result, with nothing to set up in Lumberjack. A slug uses lowercase letters, digits and : . _ -, at most 100 characters. A result with another slug or an unknown status is ignored.
Each result has a status (ok, warning or failed), a message, up to 20 numeric metrics and how long the check took. The latency_ms metric is shown as the check's latency.
A result may also carry interval_minutes, from 1 to 1440: send it when the check runs less often than every minute. The Health page shows it next to the check (every 15 min), and it sets when the check goes stale.
Database metrics
A check that watches a database may send these metrics with each result:
| Metric | Meaning |
|---|---|
size_bytes | The database's size on disk, in bytes |
connections | Connections open right now |
max_connections | Connections the database server allows |
The Health page shows them next to the latency (13.8 MB · 4 of 100 conns). They also feed the database widgets of status screens and the db_size, db_connections and db_connections_used series of the metrics API, whatever the check's slug.
When several servers report the same slug, each server has its own state and the check shows the worst of them. The row lists the hosts with their status, and the details show each host's last result.
Stale checks
A check that stops reporting shows as stale in gray, not as down. A check is stale when no result came in for:
- 2.5 times its
interval_minutes, when it sends one; - otherwise 3 times its usual spacing;
- 15 minutes while its spacing is not known yet.
A stale check has no uptime and sends no alerts until its next result. Its strip turns gray from its last result on, and the banner at the top counts stale checks next to the down and degraded ones. Archive puts away a check that will not report again, for example after you renamed its slug.
Cleaning up
- Hosts that stop reporting a check, such as a replaced pod, are removed from it after 24 hours.
- Reported checks that sent nothing for 7 days are archived. An archived check that reports again comes back with its history.
- Delete in a check's details deletes it with its results and outages. If the app still runs it, it comes back as a new check, so remove it from the app first.
Checks Lumberjack runs
Add check offers five types. Each runs every 1, 5, 15 or 60 minutes and can have an environment label. Only team owners and admins add, edit, archive and delete checks.
| Type | Checks |
|---|---|
| HTTP | A URL answers with the expected status, optionally with a text in the body. Warns when slower than a limit you set. |
| SSL | A host's certificate: warns a number of days before it expires and fails close to it. |
| TCP | A port accepts a connection. |
| DNS | A name has records of a type, optionally one with the value you expect. |
| Heartbeat | A dead man's switch: your cron job or backup calls a secret URL when it is done; the check fails when no call came within its interval plus a grace. |
| Type | Fields (default) |
|---|---|
| HTTP | URL, method (GET, HEAD or POST; GET), expected status (200), body contains, warn when slower than (1 to 60,000 ms), timeout (1 to 30 s; 10) |
| SSL | Host, port (443), warn days before expiry (14), fail days before expiry (3) |
| TCP | Host, port, timeout (1 to 30 s; 5) |
| DNS | Name, record type (A, AAAA, CNAME, MX, TXT; A), expected value |
| Heartbeat | Grace (0 to 1,440 minutes; 5) |
Every check also has a name, a description and the thresholds described under Status, each from 1 to 100.
A heartbeat check shows its ping URL and a curl line to copy. The URL takes GET or POST without a body, at most 60 times a minute:
php artisan backup:run && curl -fsS -m 10 https://lumberjack.example.com/api/health/ping/...Private networks
HTTP, SSL and TCP checks only reach public addresses. A host that resolves to a private, loopback, link-local or otherwise reserved address is rejected, in IPv4 and IPv6. Redirects are followed up to three times, each checked the same way.
To watch internal services, turn this off:
LUMBERJACK_HEALTH_ALLOW_PRIVATE=trueStatus
A single bad result does not change a check's status. Three thresholds move it, each counted per host:
- After degrade after (2) bad results in a row (warnings or failures) it is degraded.
- After down after (5) failed results in a row it is down. A warning in between restarts that count, so a check that only warns never goes down.
- On a good result after that it is recovering: still part of the outage. After recover after (5) good results in a row it is ok again. A bad result while recovering puts it back where it was, degraded or down.
A down after below degrade after counts as degrade after. Set both the same to go straight from ok to down on failures.
A check that was ok, fails every minute and then passes again, with the defaults:
| Minute | Result | Status |
|---|---|---|
| 1 | failed | ok |
| 2 | failed | degraded |
| 3 to 4 | failed | degraded |
| 5 | failed | down |
| 6 | ok | recovering |
| 7 to 9 | ok | recovering |
| 10 | ok | ok |
It sends a degraded alert at minute 2, a down alert at minute 5 and a recovered alert at minute 10. Recovering sends no alert.
Checks the app reports send their own thresholds. In the check's details you can override them per slug; leave all three empty to use the app's again. The details also hold a display name, a description and mute: a muted check is still shown but sends no alerts.
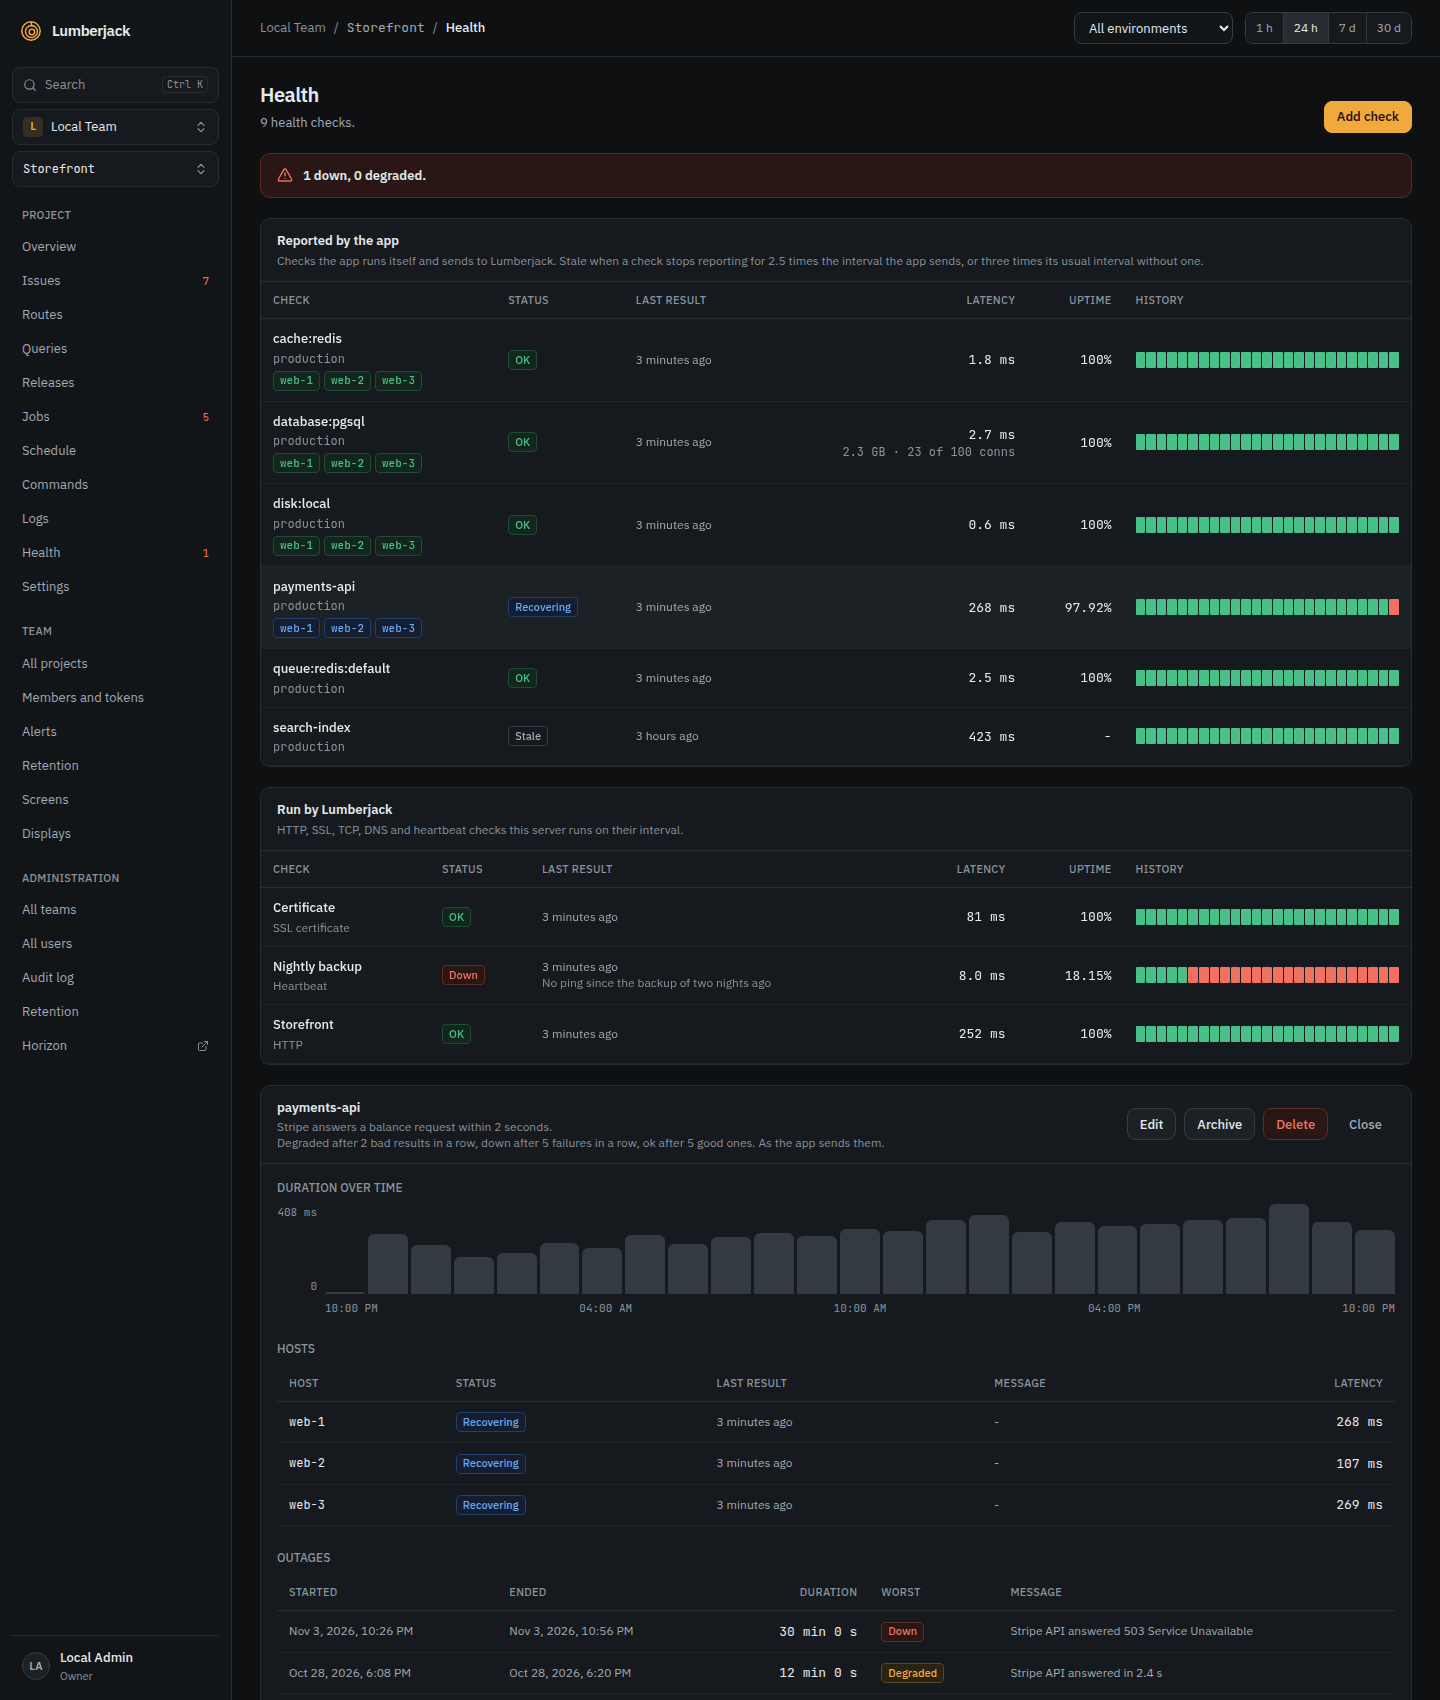
Outages and uptime
An outage starts when a check becomes degraded or down and ends when it is ok again, so it stays open while the check is recovering. The details list the last 20 outages with their duration and worst status, the last 50 results and a chart of how long the check took. Restore an archived check from the Archived list.
Uptime is the share of the period, picked at the top of the page, in which the check was not down, counted from when the check was added. Degraded time counts as up; recovering time counts as part of the outage. The strip on each row has one segment per part of the period, colored by the worst status in it.
On the overview and sidebar
The project overview shows how many checks are ok, and every check as a chip, worst first: down in red, degraded in amber, recovering in blue, stale and pending in gray. Hover a chip for its last message. The sidebar counts the checks that are degraded or down.
Alerts
Three alert rules send health alerts. All are on by default, and each has its own channels and environments:
| Rule | Sent when |
|---|---|
| Health check degraded | A check keeps warning or starts failing |
| Health check down | A check keeps failing, also when a degraded check goes down |
| Health check recovered | A check is ok again |
The rules are independent: with Health check degraded off, the later down and recovered alerts are still sent.
Each step for the worse is sent at once: ok to degraded, and degraded to down. Going from recovering back to degraded or down is not a new alert. Muted and archived checks send no alerts. See Alerts for the webhook body.
Reading states from the app
The app can read the state of its reported checks, for example to skip a broken dependency. Lumberjack answers in two places, with the same body:
- The agent's heartbeat.
POST /api/ingest/heartbeatanswers with the states underhealth. An agent that sendsenvironmentgets the checks of that environment; without it, those of every environment. GET /api/health, with the server token as a bearer token, for apps without an agent.?environment=and?slug=narrow the list. A missing or unknown token gets a 401. More than 120 requests a minute per project get a 429.
{
    "checks": [
        {
            "slug": "disk:s3",
            "environment": "production",
            "state": "down",
            "since": "2026-11-03T09:12:00+00:00",
            "message": "No space left on device",
            "hosts": [
                { "host": "web-1", "state": "ok" },
                { "host": "web-2", "state": "down" }
            ]
        }
    ],
    "at": "2026-11-03T09:15:04+00:00"
}| Field | Meaning |
|---|---|
slug | The check's slug |
environment | Its environment, null for a check sent without one |
state | ok, degraded, down, recovering, stale or pending (no result yet) |
since | When it entered the state; for stale, its last result. null when nothing came in yet |
message | The latest result's message, null when it had none |
hosts | Only when several servers report the slug: each server's own state |
at | When the answer was made |
Only checks the app reports are listed, without archived ones.
Limits
| What | Limit |
|---|---|
| Checks Lumberjack runs, per project | 50. Set LUMBERJACK_HEALTH_MAX_CHECKS to change it |
| Timeout of a check | 15 seconds |
| Body an HTTP check searches | The first megabyte |
| Metrics per reported result | 20 |
| Heartbeat pings | 60 a minute |
GET /api/health | 120 requests a minute per project |
| Kept results and outages | 14 days and 365 days by default, see retention |