


Lumberjack
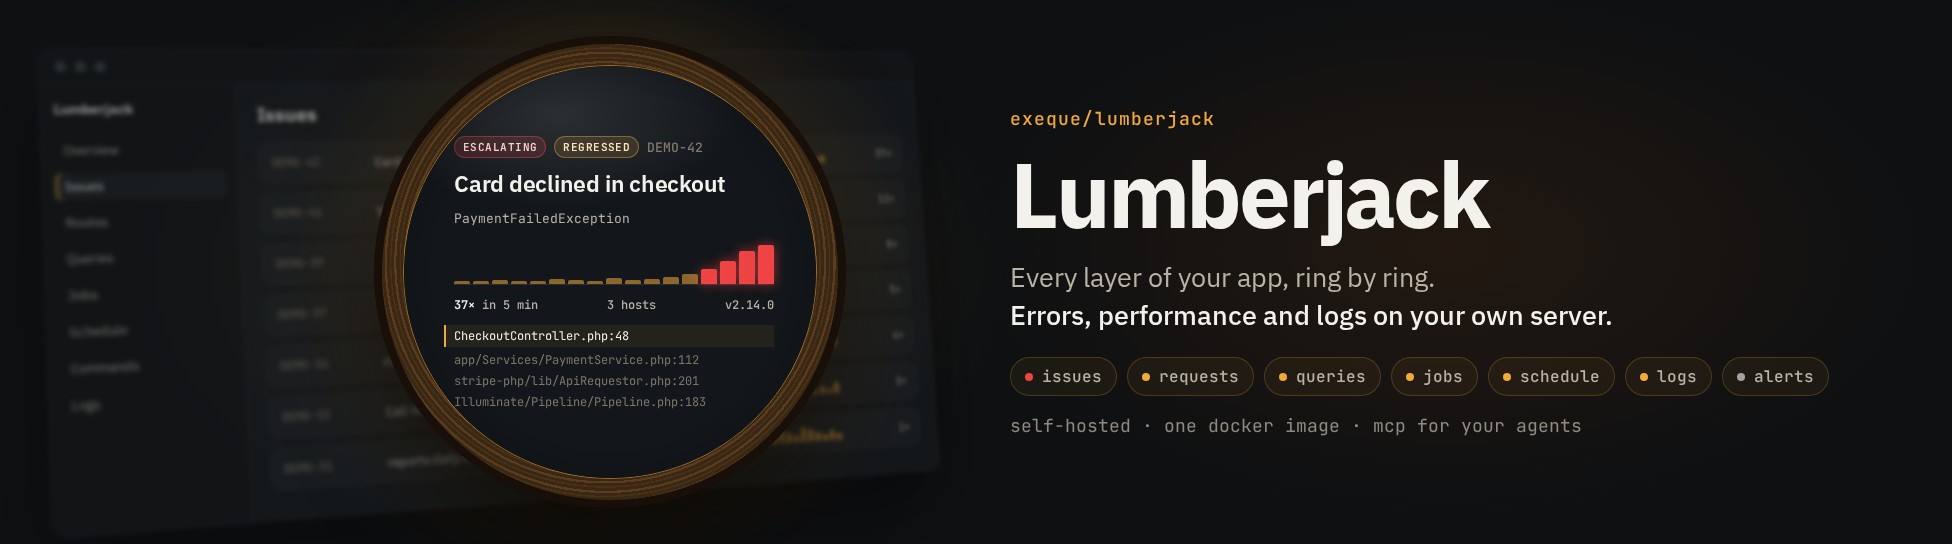
Lumberjack watches your apps from your own server, whatever they are built with. It collects errors, logs and performance data, runs health checks, sends alerts, shows status screens on a TV and lets AI agents work with your issues over MCP.
What you can do with it
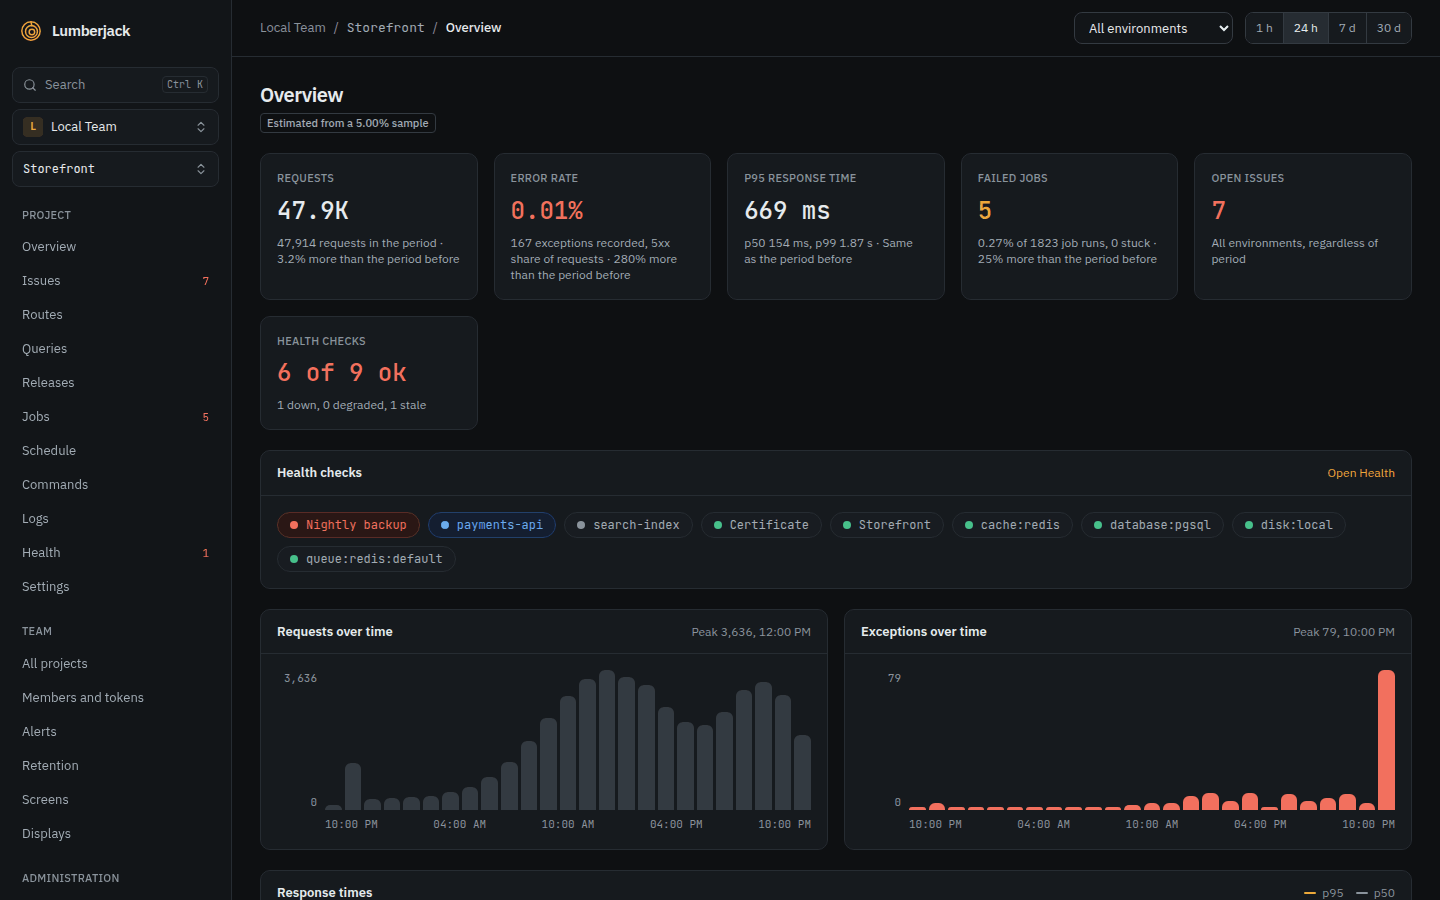
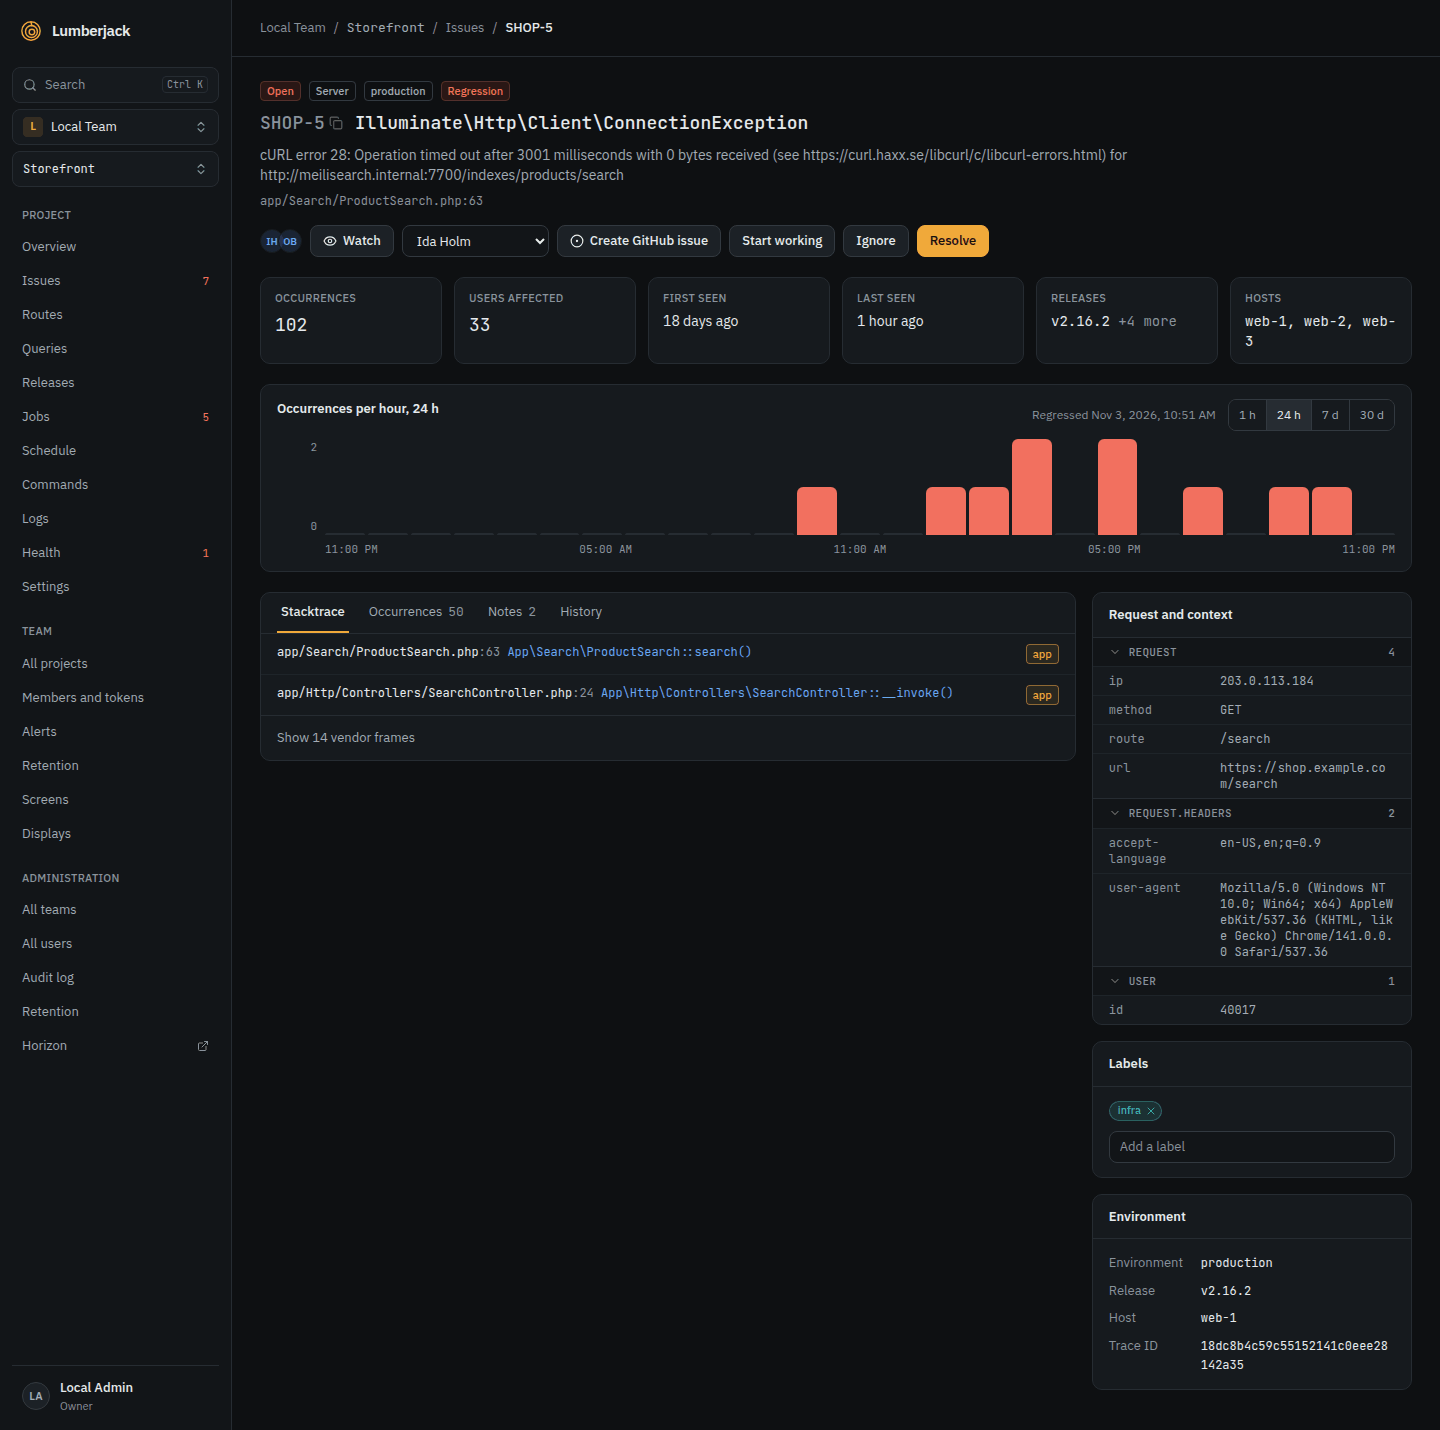
- Know when production breaks. Exceptions, browser errors and error logs become issues, and an alert reaches you by email, Slack, Microsoft Teams, Discord, Telegram, ntfy, Pushover or a webhook.
- Find out why a page is slow. Response times, Web Vitals, queries and N+1 hints per route, down to a single trace.
- Check a release. See which deploy brought new errors or slowdowns.
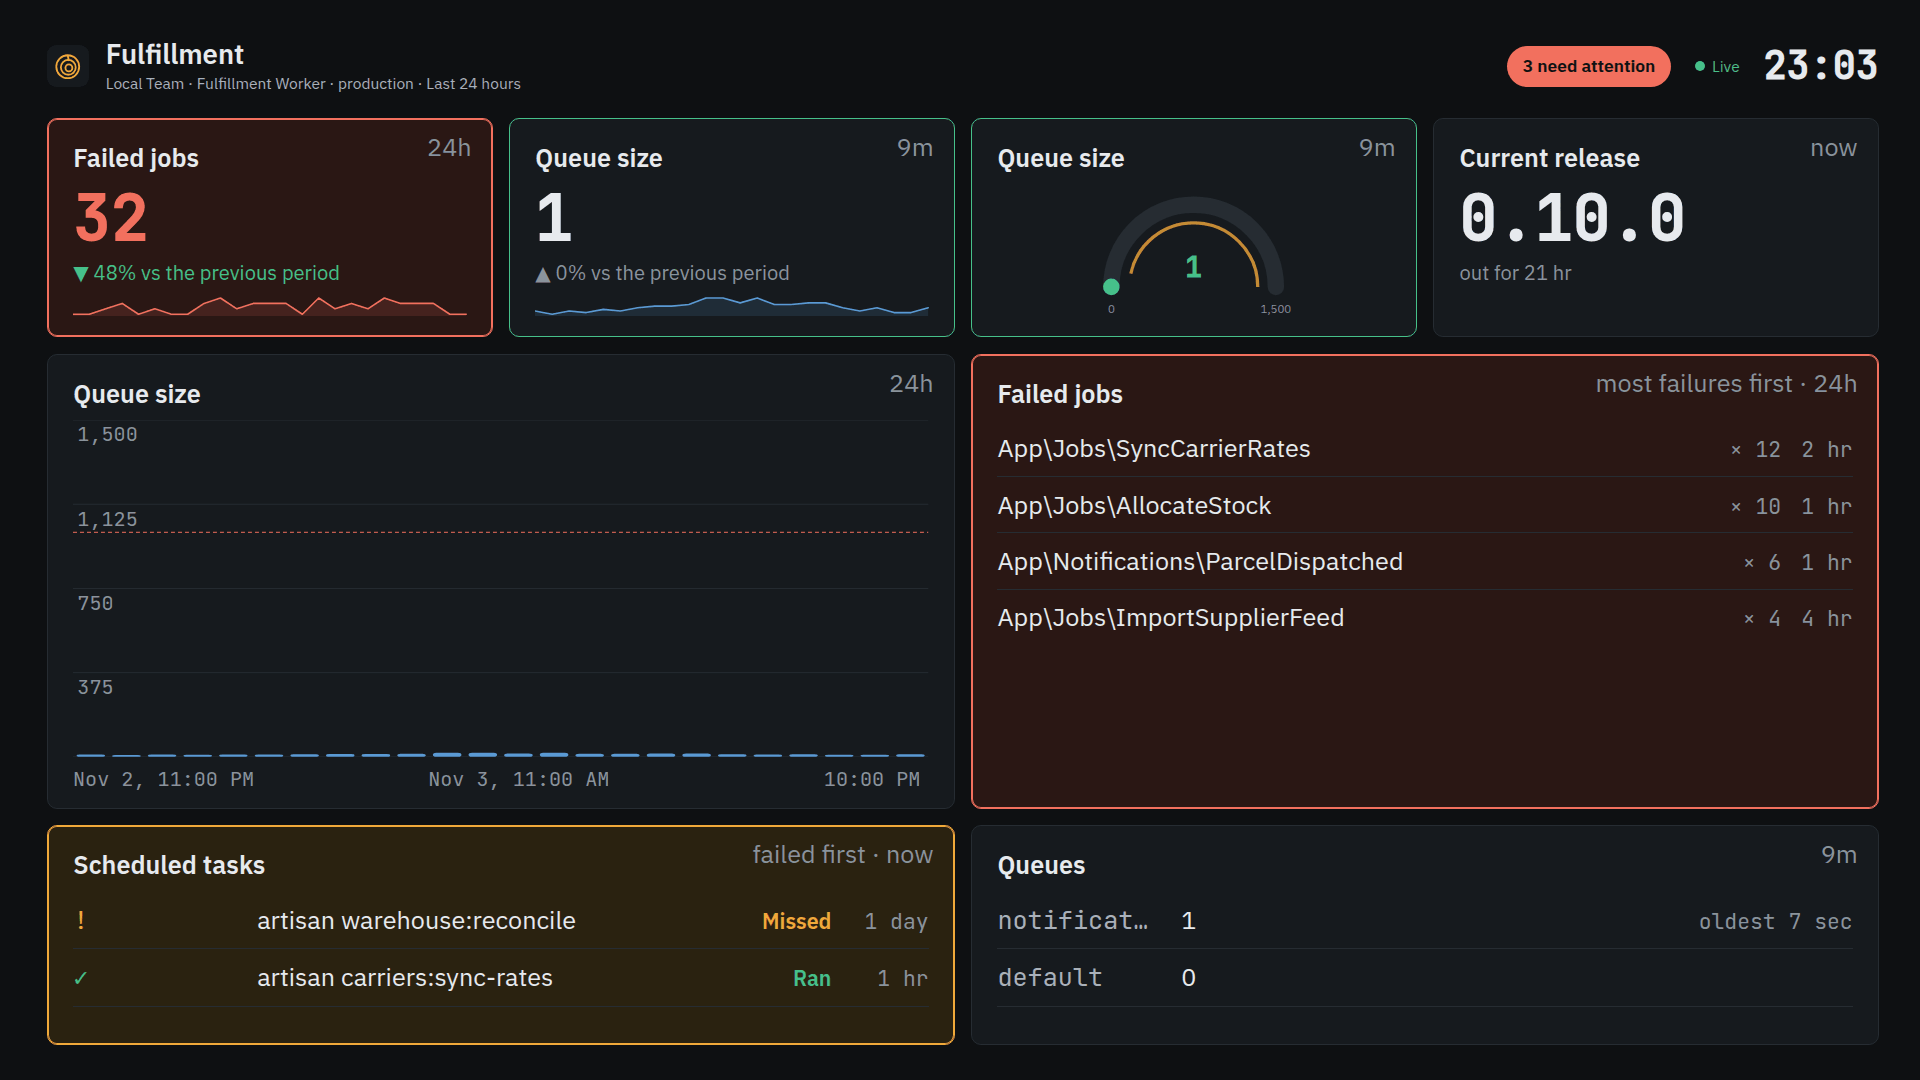
- Watch background work. See which jobs, scheduled tasks and commands failed or never ran, and which queues back up.
- Check that your sites are up. Run HTTP, SSL, TCP, DNS and heartbeat checks, and track outages and uptime.
- Search your logs, or watch them live.
- Put a status screen on the wall. Design a dashboard and show it on any TV.
- Let an AI agent read your errors. Agents can triage issues, write notes, open issues in your repository and draft pull requests.
Get started
Lumberjack runs as one Docker image, with Postgres and Redis beside it. On a server with Docker or Podman:
bash
curl -fsSL https://exeque.github.io/lumberjack/install.sh | shRunning Lumberjack with Docker has the whole setup. Your apps send data through a library, such as exeque/laravel-lumberjack for Laravel, or straight to the ingest API from any language or framework.
Guides
- Get alerted when production breaks
- Find out why a page is slow
- Check a release
- Watch queues, jobs and scheduled tasks
- Put a status screen on a TV
- Let an AI agent work with your errors
- Show Lumberjack data in Grafana
Reference
- Running Lumberjack with Docker: installation, settings, reverse proxy, backups and updates.
- Libraries: the libraries your apps send data with.
- Setup and administration: first-run setup, recovery, administrators and the command line.
- Teams and accounts: members, roles, invitations, your profile and two-factor authentication.
- Projects
- Issues
- Alerts
- Performance and traces
- Releases
- Health
- Finding things: search, filters and the command palette.
- Status screens and widgets
- MCP
- Metrics API: read figures from Grafana, Prometheus or a script.
- Ingest and API: the endpoints SDKs and agents send to, and their limits.
- Development: run Lumberjack from source, demo data and screenshots.